v1.6.0 - 2024-12-18
Introduction
This release focuses on expanding our knowledge sources and enhancing our search capabilities. We've introduced several key features that make climate research more intuitive and thorough.
Key Features
- Main Feature: Expanded Knowledge Sources
- Integrated OpenAlex API for scientific publication search
- Added Our World in Data graph retrieval capabilities
- Improved Source Prioritization
- Modified retriever to prioritize IPCC Summary for Policymakers
- Ensures global, high-level insights before diving into technical details
- Implemented parallel search mechanisms for documents and graphs
- UI/UX Changes
- Added a "Recommended content" tab for elements that are not used by the chatbot
- Added notification dynamic to highlight retrieved documents
- Updated configuration panel and added standalone search mode
- Added the two last reports from IPBES
- "Nexus Assessment Report" : Summary for policymakers of the thematic assessment of the interlinkages among biodiversity, water, food and health (nexus assessment) of the Intergovernmental Science-Policy Platform on Biodiversity and Ecosystem Services
- "Transformative Change Assessment Report" : Summary for policymakers of the thematic assessment of the underlying causes of biodiversity loss and the determinants of transformative change and options for achieving the 2050 Vision for Biodiversity
Focus: Our World in Data - Visual Insights
Our World in Data integration brings comprehensive climate visualizations directly into ClimateQ&A, transforming how users understand global climate trends.
- Visualization Capabilities
- Access to hundreds of peer-reviewed, meticulously sourced graphics
- Interactive graphical interface to explore data
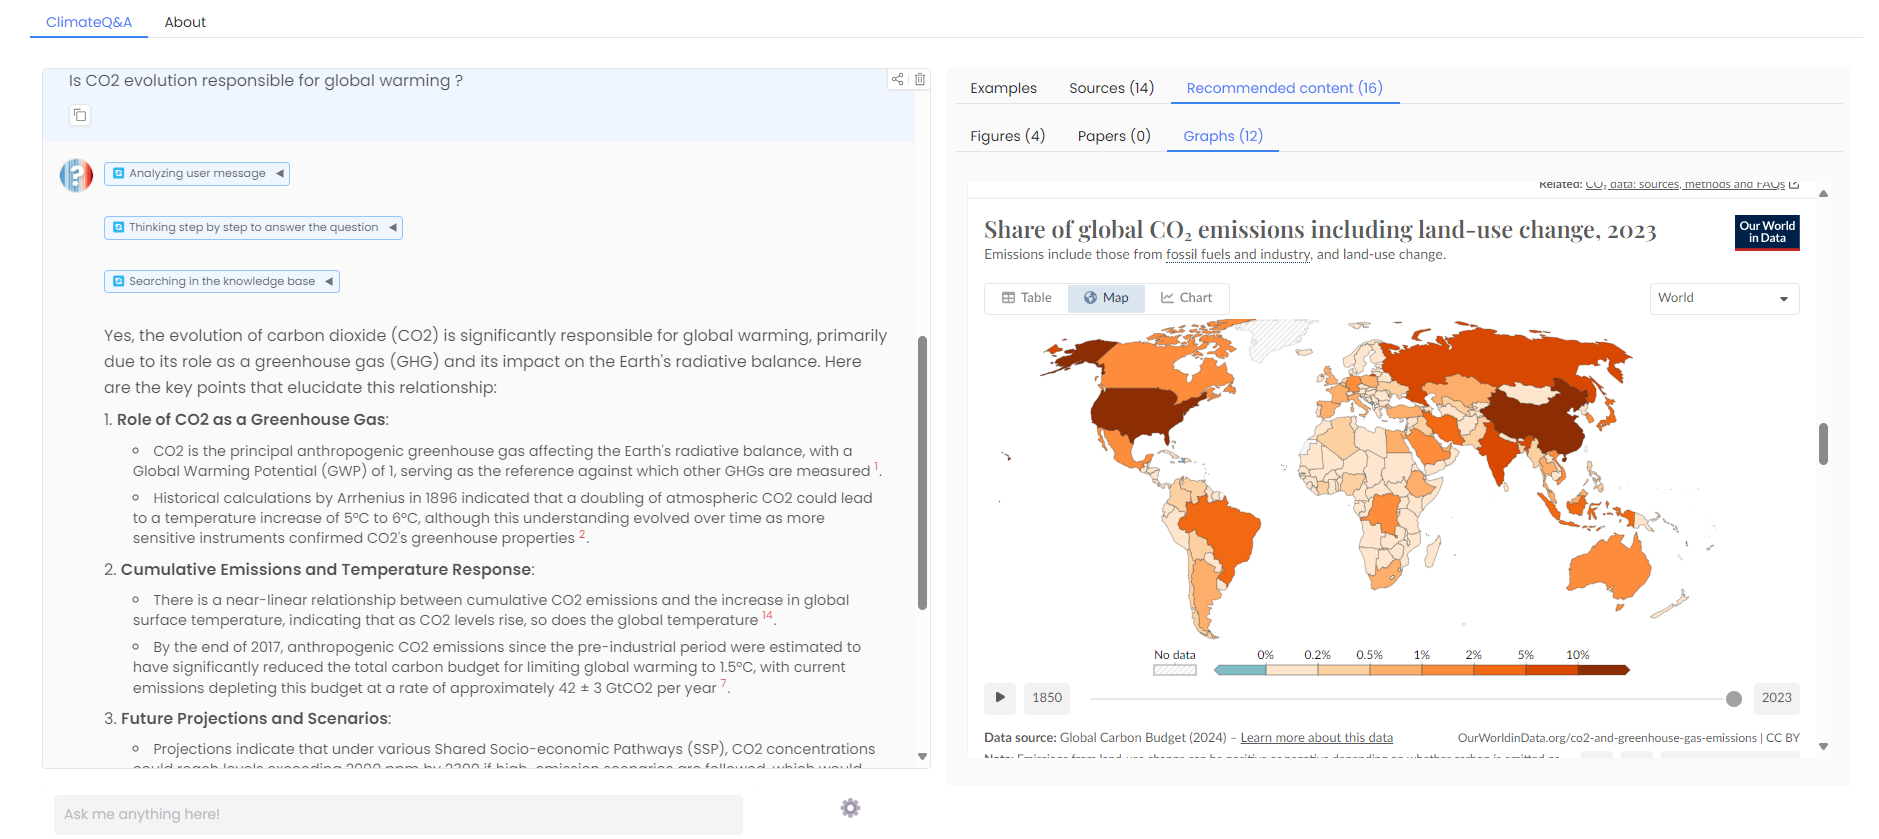
Interactive interface
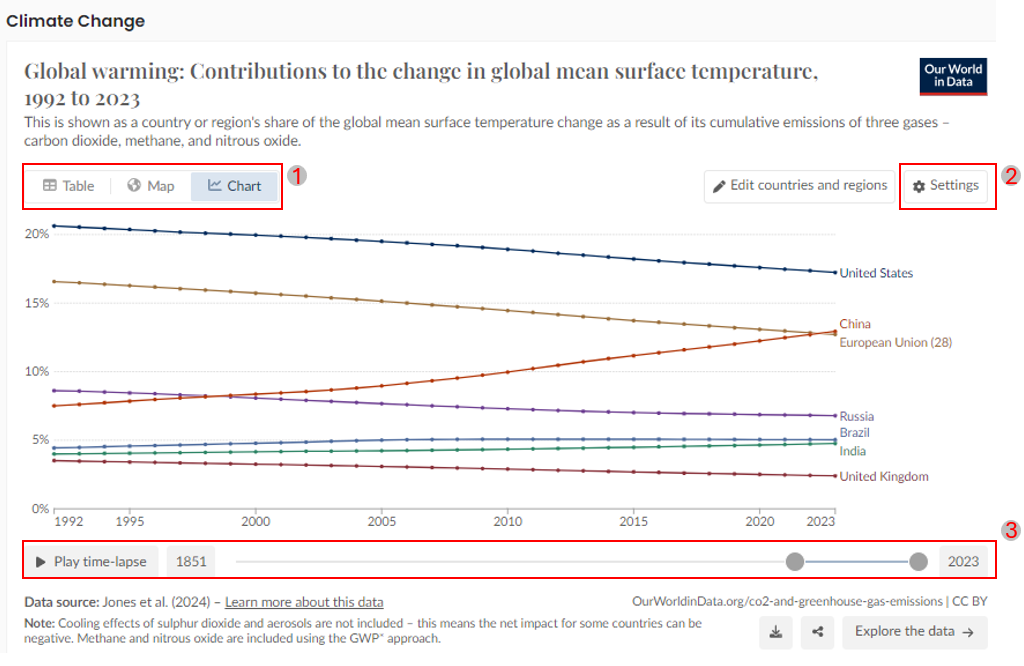
- View Options (Chart, Map, Table) The graphic allows you to switch between different views: Chart, Map, and Table. These options are located at the top left corner (marked as 1 in the image).
- Chart: Displays the data as a line graph, showing the trend over time.
- Map: Provides a geographical representation of the data.
- Table: Presents the data in a tabular format for detailed numerical information.
- Settings and Customization
- You can customize display and select countries to compare.
- Time-lapse and Year Selection
- You can select a specific year using the slider or by entering the year in the input box. This helps in comparing data for different years directly.
Visualization Categories Our World in Data provides a wide range of visualizations covering various climate-related topics:
- Air Pollution
- Biodiversity
- CO2 & Greenhouse Gas Emissions
- Climate Change
- Energy
- Environmental Impacts of Food Production
- Environmental Protection & Regulation
- Fertilizers
- Forests & Deforestation
- Fossil Fuels
- Land Use
- Meat & Dairy Production
- Plastic Pollution
- Transport
- Waste Management
- Water Pollution
Focus: OpenAlex - Scientific Publication Integration
Introducing open papers document search from user queries. See more details here: https://climateqa.com/blog/openalex
Interface Walkthrough
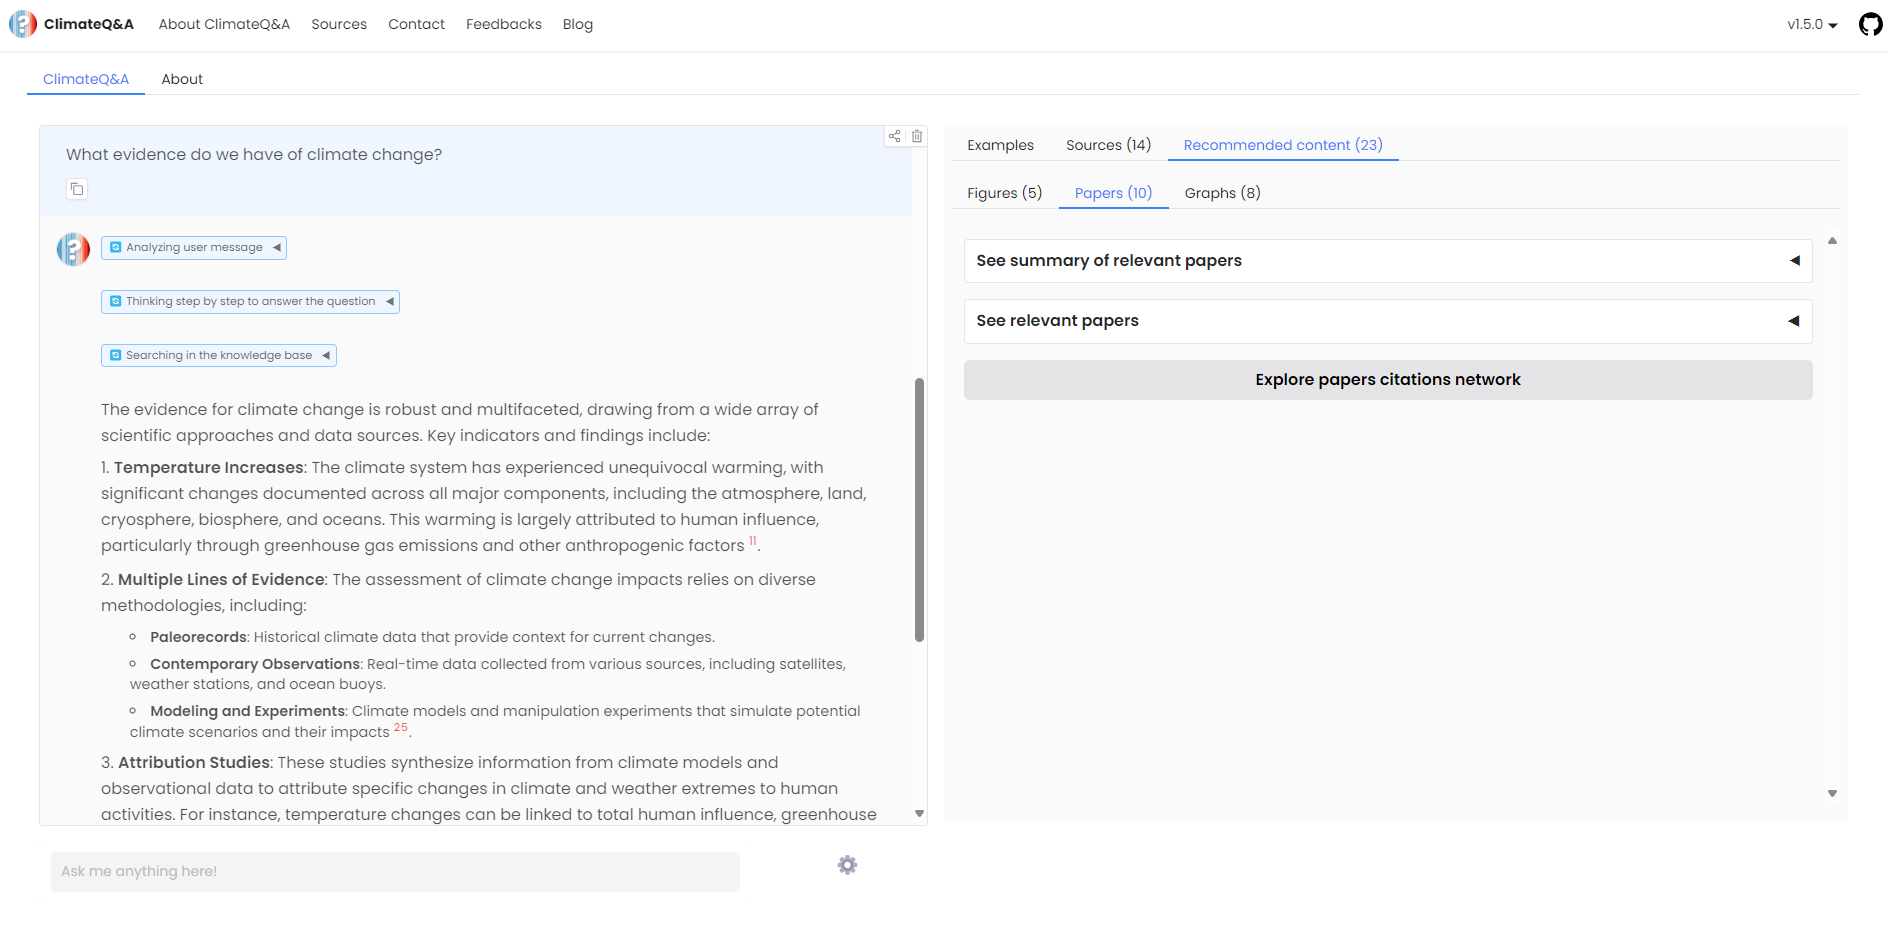
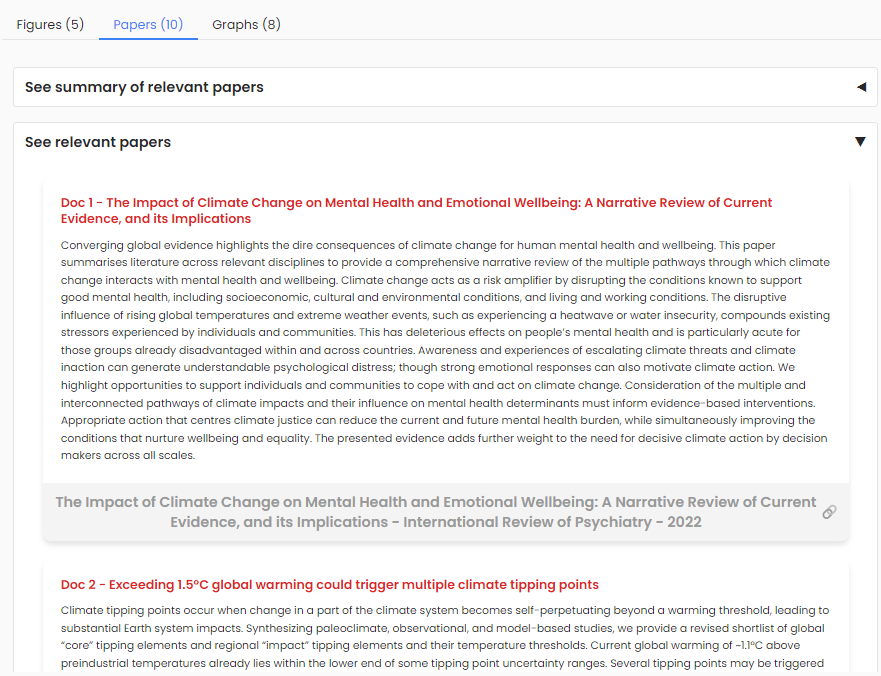
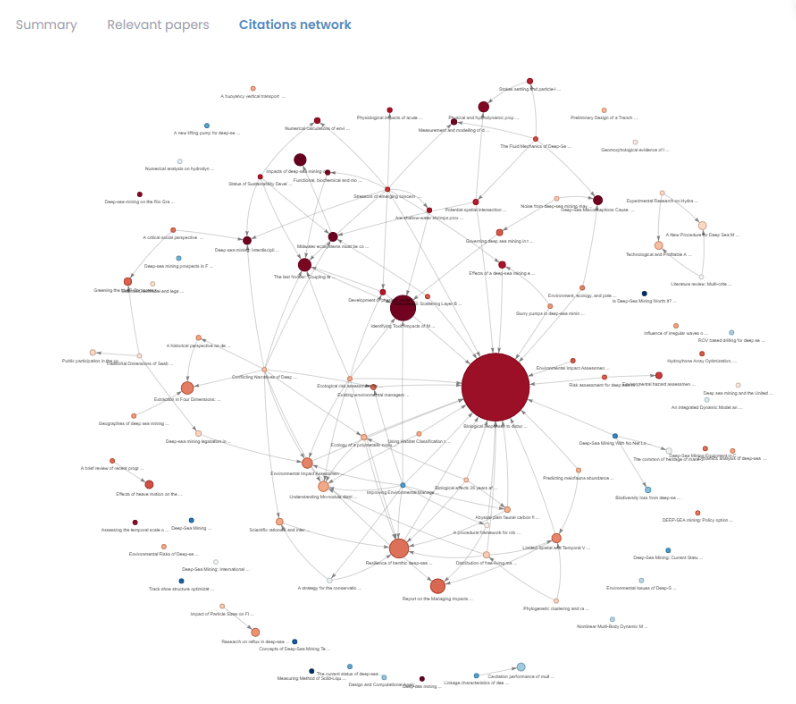
Relevant papers are displayed in the relevant content tab with 3 different views:
-
Papers summary view
-
Papers list view
-
Citation network view
-
Papers summary view Provides a summary of the relevant papers retrieved from the query.
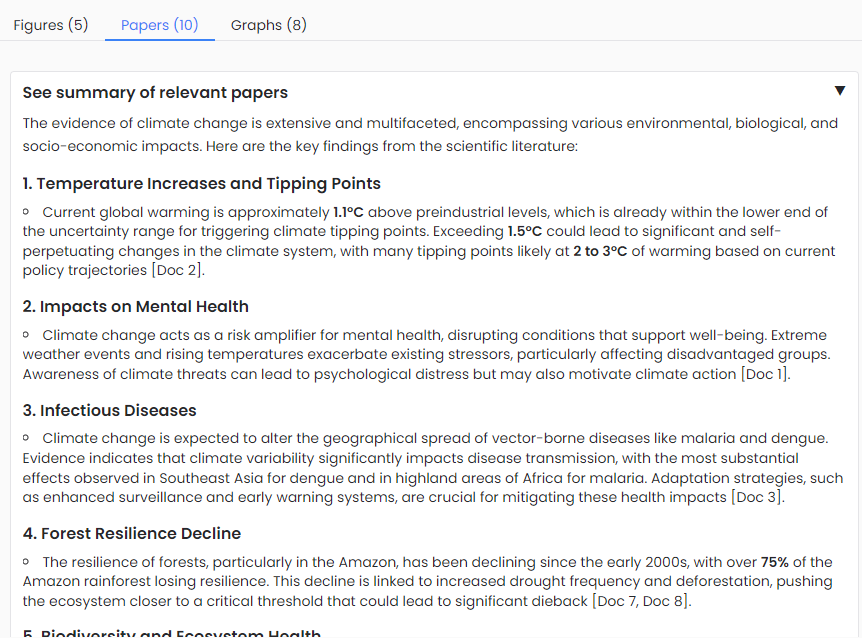
- Papers list view Provides a list of the relevant papers retrieved from the query.
- Citation network view
Provides a citation network of the relevant papers retrieved from the query.
Focus Workflow update
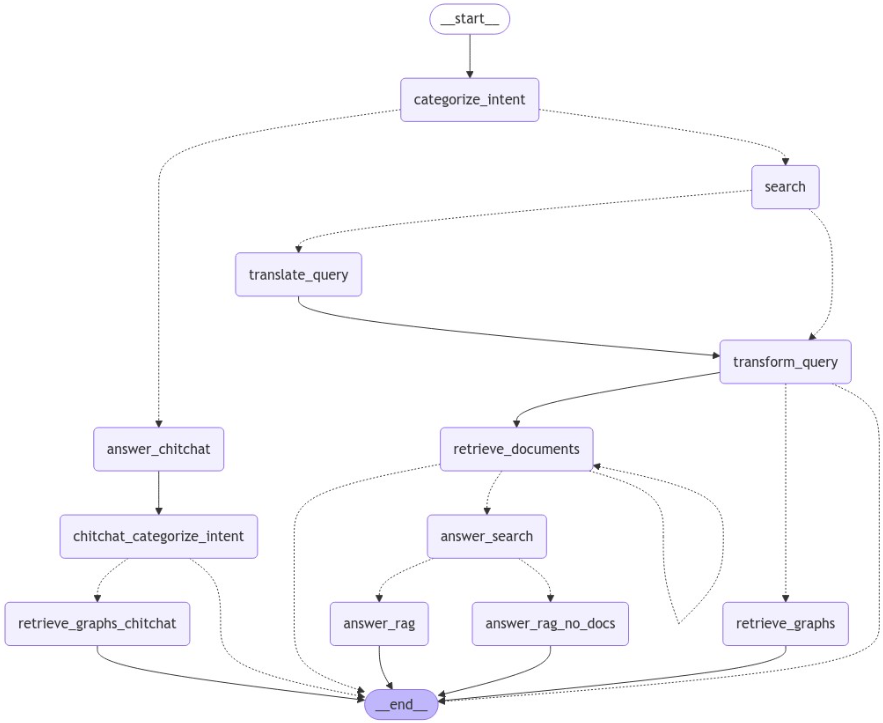
The workflow has been updated to retrieve simultanously documents and OWID graphs. Papers search is currently handled in a separate workflow with gradio
Coming next: Version 1.7
Our next release will focus on accessing granular data to answer local concerns.